Quiescent neural stem cells transiently become neuron-like to coordinate long-range reactivation
Gherghina et al., 2026. The EMBO Journal.
Gherghina et al., 2026. The EMBO Journal.
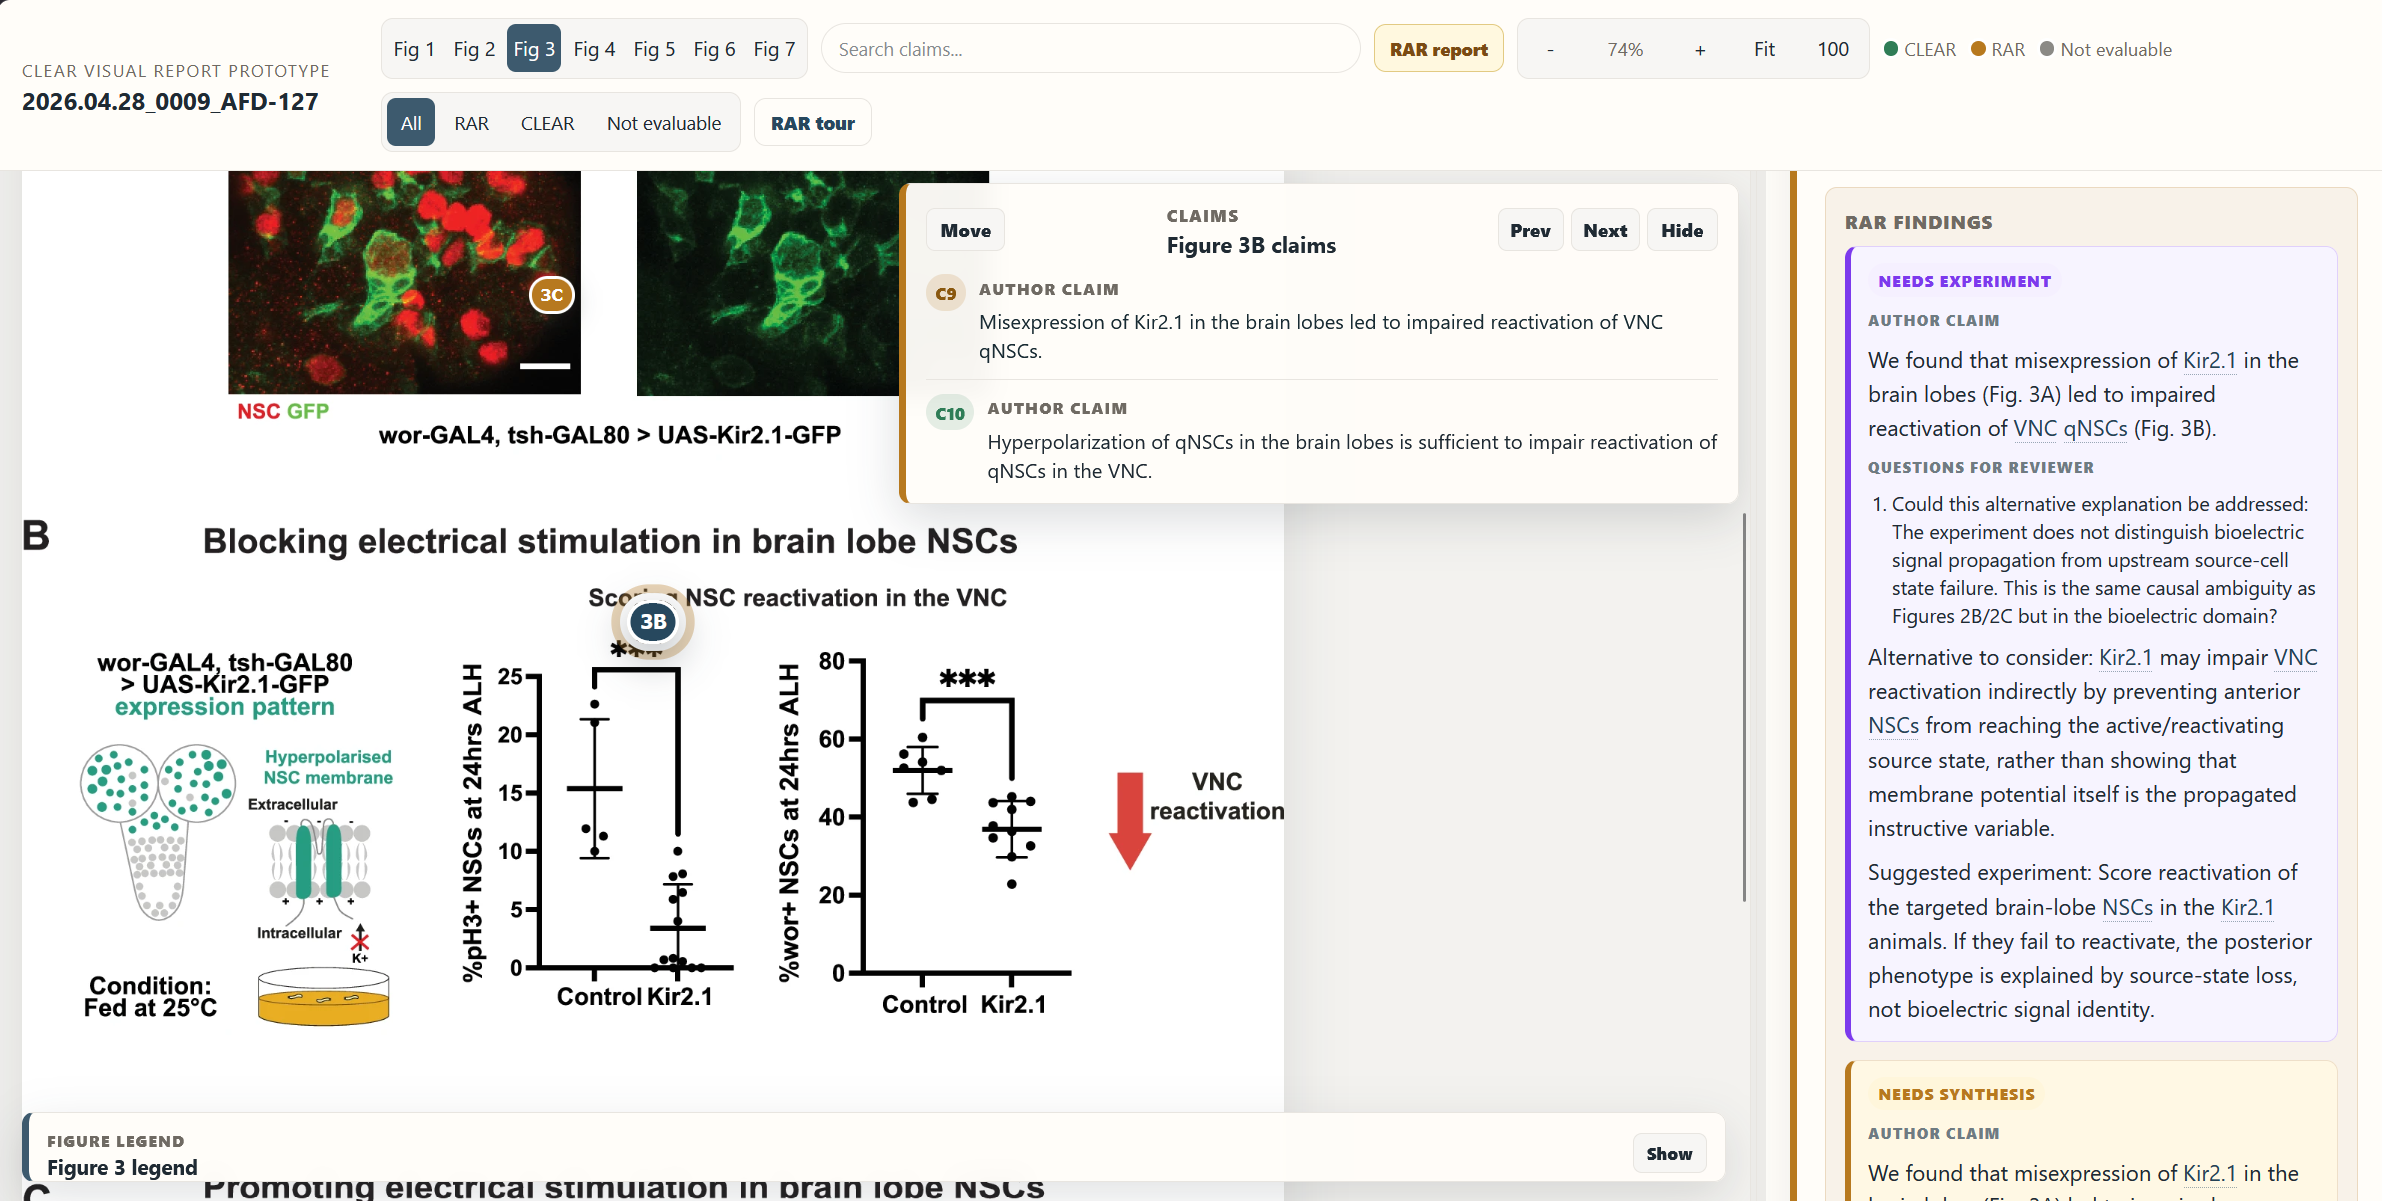
RAR is the public-facing reviewer attention layer on top of CLEAR. It keeps the figure first, keeps author claims visible, and surfaces only the places where a reviewer should inspect the evidence, compare panels, or ask for a discriminating experiment.
Demo analysis: AFD-127. The by-figure CLEAR report remains the internal source artifact; RAR is the homepage-facing reviewer support surface.
Gherghina et al., 2026. The EMBO Journal.
Lauder et al., 2026. Nature Immunology.
Original paper: Quiescent neural stem cells transiently become neuron-like to coordinate long-range reactivation
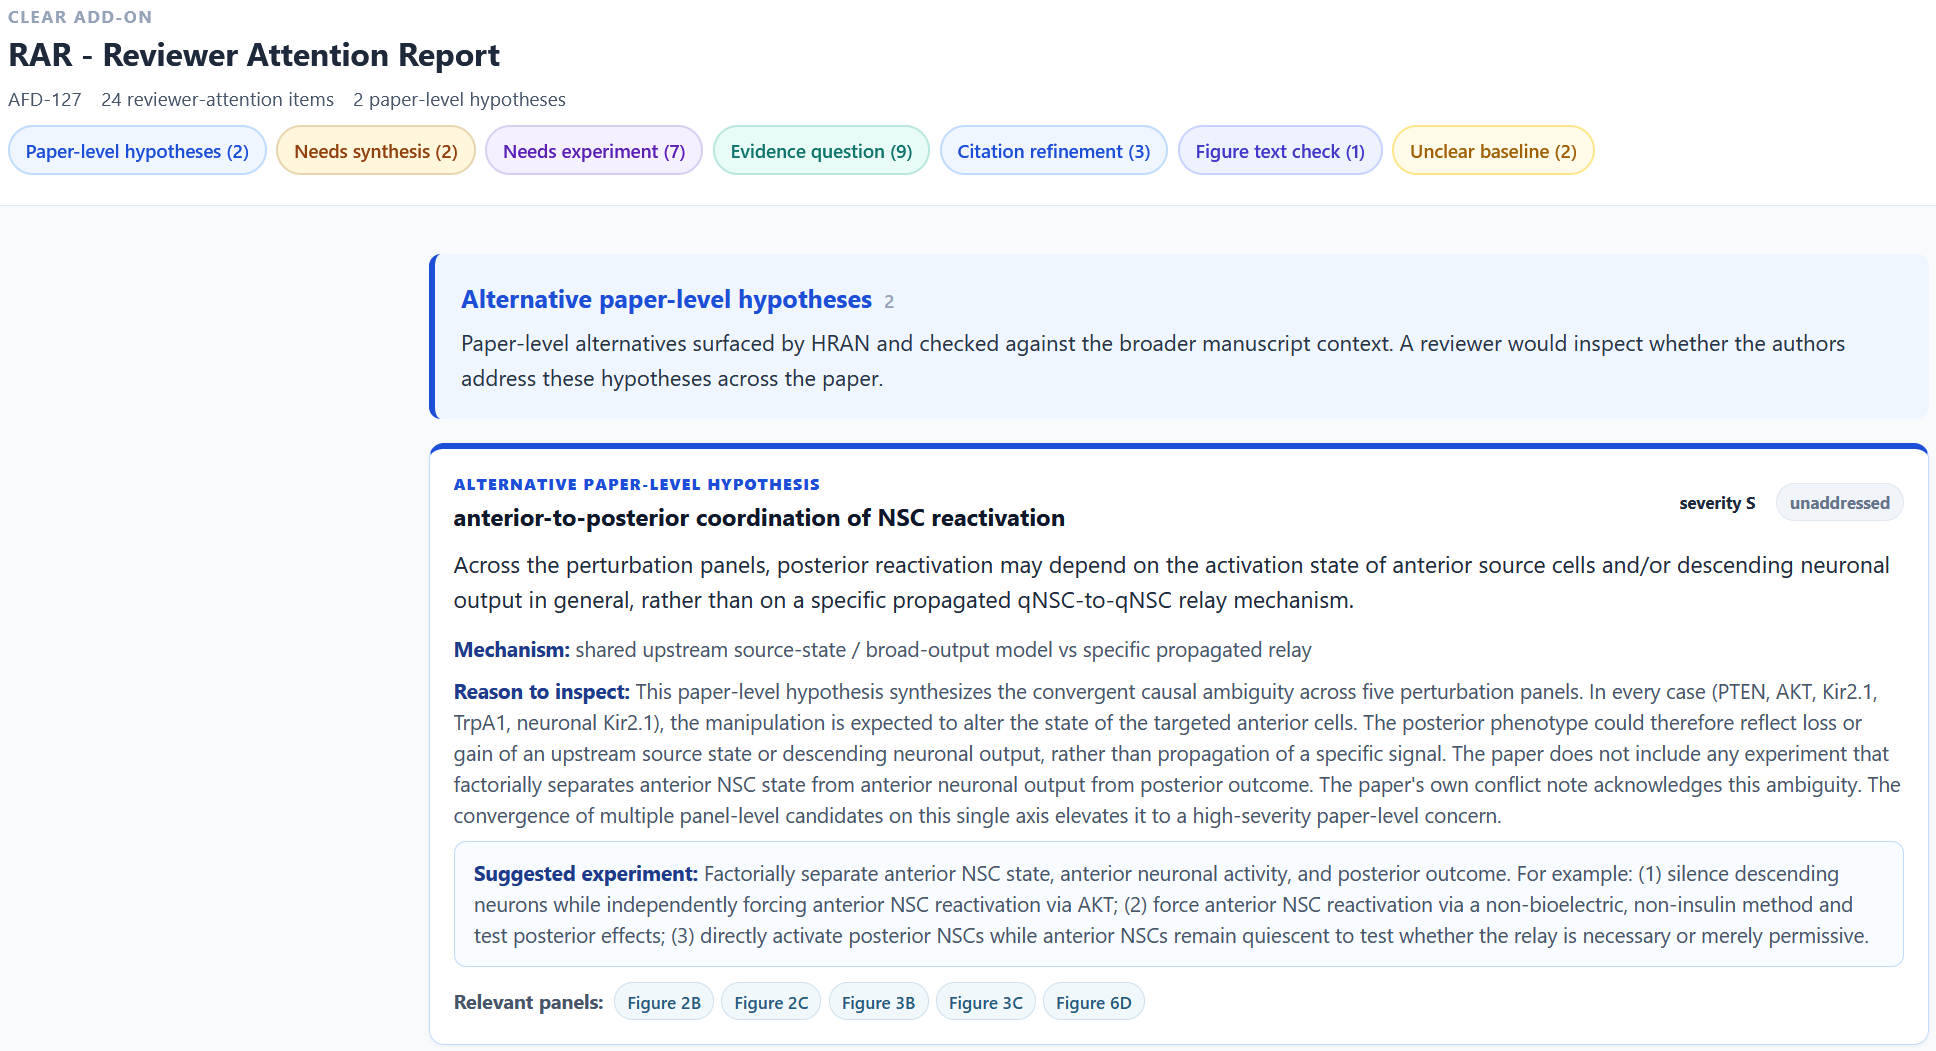
The standalone RAR collects evidence questions, synthesis points, supplementary lookups, and paper-level alternative hypotheses. It replaces the old dense machine-facing report for demo purposes.
CLEAR extracts claims, methods, materials, figure panels, graph regions, and alternative hypotheses. RAR uses that structure to guide the eye: what did the authors claim, what panel is involved, and what should a careful reviewer check next?